
![171 Latest Digital Marketing Statistics 2025 [Trends & Facts]](https://www.dotdesh.com/wp-content/uploads/2025/12/untitled-design-2024-12-26t171137.940-512x268.png)
![171 Latest Digital Marketing Statistics 2025 [Trends & Facts]](https://www.dotdesh.com/wp-content/uploads/2025/12/untitled-design-2024-12-26t171137.940.png)
Digital marketing in 2025 is over $734.6 billion in global ad spending. As a result, 58% of small businesses now rely on digital channels.
On average, businesses earn $5 for every $1 spent on digital marketing, with email alone yielding 3600% ROI.
It is interesting to note that 347.3 billion emails are sent daily to 4.95 billion active social media users, and digital touchpoints are everywhere.
SEO drives 53% of website traffic, and programmatic advertising is expected to cover 87% of all ad revenue by 2026. Let us study these facts in detail now.
Digital Marketing Statistics 2025 (Top Picks)
- Around 58% of small businesses rely on digital marketing to connect with their customers.
- For every $1 spent on digital marketing, businesses typically earn a $5 return.
- Global digital ad spending is steadily increasing and is expected to hit $734.6 billion by 2025..
- On average, businesses will spend $45.11 per user on social media ads.
- By 2026, smartphones will drive 69% of total ad spending.
- Programmatic advertising will account for 87% of digital ad revenue by 2026.
- Social media ad spending is set to exceed $230 billion.
Source: Statista, WordStream, PR Newswire.
What Percentage Of Companies Use Digital Marketing?
About 58% of small businesses use digital marketing to reach their customers.
This makes it a common strategy for businesses of all sizes. Most rely on social media, email marketing, SEO, and content marketing to engage their audience online.
The number of businesses investing in digital marketing is steadily growing, with many dedicating a large share of their marketing budgets to online channels.
Some of the most popular digital marketing methods include social media ads, SEO, email campaigns, content creation, video marketing, and podcast marketing.
Source: Hostinger
General Digital Marketing Stats

- 49% of marketers say that organic search has the best ROI.
- 20% of businesses say they measure Digital Marketing’s success by measuring the number of leads generated.
- 72% of the marketing budget goes towards Digital Marketing, according to a survey from Gartner.
- Google processes 8.5 billion searches each day.
- Google is the world’s biggest search engine, catering to 92% of global searches.
- The marketing job demand is set to increase by 10% by 2026, as per a survey by the Bureau of Labor.
- Customers spend 50% more with businesses that respond to reviews regularly.
- Over 90% of people read reviews online before making a purchasing decision.
- Digital Advertisements can increase a brand’s awareness by 80%
- 62% of marketers use software for Customer Relationship Management.
Sources: TechJury, Statista, Wikipedia, Gartner, Bureau of Labor, WordStream, Hubspot.
Digital Marketing Growth Statistics
Between 2024 and 2032, the digital marketing market is estimated to grow at a CAGR of 13.1%.
In 2023, the digital marketing market was valued at $363.05 billion and is projected to reach $1099.33 billion by the end of 2032.
Some of the major drivers of the industry are the growth of mobile creators and the focus on niche content, the rise of interactive content, and the growth in artificial intelligence.
The Asia-Pacific region is seeing the fastest growth in the global digital marketing space, primarily due to rising demand across key sectors like education, banking and financial services (BFSI), and media and entertainment.
Source: Expert Market Research
Digital Marketing Facts On ROI
For every dollar invested in Digital Marketing, businesses witness an average return of $5.
However, most marketers usually aim for higher returns on their digital marketing efforts.
However, the ROI in the digital marketing industry varies greatly depending on the channel used.
Investments in email marketing have the highest ROI, and businesses usually get a return of $36 on every $1 spent on the channel.
Further, for every $1 spent on SEO, businesses receive a return of $22, and for every dollar spent on PPC Ads, businesses receive $2 in return.
Source: Luca Tagliaferro
Email Marketing Statistics
Email Marketing is a crucial element in Digital Marketing. It can get you an ROI of $36 if you do it right. That is 3600% returns. Crazy right? When you form your email marketing strategy, keep the following statistics in mind.

You can also check our dedicated post on Email Marketing Statistics to brainstorm your next campaign.
- 4.37 billion people around the globe send 347.3 billion emails every day.
- There will be 4.73 billion email users by 2026.
- Emails that include a call to action button have 37% higher click-through rates.
- More than a quarter of emails (36.6%) are opened by smartphone users every day.
- Mobile-friendly email is the second most popular strategy implemented by email marketers to increase their ROI.
- 20% of marketing email campaigns are not optimized for mobile phones.
- Revenue from Email Marketing is worth $8.49 billion.
- Mondays have the highest opening rate (22%), while Sundays have the lowest with 20.3%.
- Tuesdays have the highest click-through rates (2.4%), while Saturdays and Sundays have the lowest CTR (2.1%).
- 82% of digital marketers implement email marketing globally, out of which 65% use automated emails.
- 48% of brands make use of videos in their email marketing campaigns.
- Nearly 70% of email recipients can tell if an email is spam simply by reading its subject line.
- The conversion rate increases by 56% if an Email has an emoji in its subject line rather than plain text.
- Marketing emails have an open rate of 18%, a CTR of 2.6%, and a CTOR of 14.1% globally.
- The unsubscribe rate of marketing emails is 0.1% globally.
- Customers spend 10 seconds going through brand emails on average.
- 46% of customers prefer to be contacted by brands via email.
Digital Advertising Statistics 2025
- The Digital Marketing industry is predicted to reach $740.3 billion.
| Type of Advertising | 2024 | 2025* | 2026* | 2027* | 2028* |
|---|---|---|---|---|---|
| Audio Advertising | $11.1 billion | $11.9 billion | $12.4 billion | $12.8 billion | $13.2 billion |
| Banner Advertising | $174.4 billion | $185.9 billion | $196.5 billion | $207 billion | $217.6 billion |
| Classifieds | $21.7 billion | $22.1 billion | $22.5 billion | $23 billion | $23.4 billion |
| Influencer Advertising | $35.1 billion | $39.3 billion | $43.5 billion | $47.8 billion | $52 billion |
| Search Advertising | $306.7 billion | $334.4 billion | $362.3 billion | $389.8 billion | $417.4 billion |
| Video Advertising | $191.3 billion | $205.1 billion | $217.7 billion | $229.8 billion | $241.9 billion |
| Total | $740.3 billion | $798.7 billion | $854.9 billion | $910.3 billion | $965.6 billion |
- The average ad spending per user in the In-App Advertising market is projected to amount to $63.7.
- 65% of total ad spending will be generated through mobile phones.
- The United States will have the largest digital advertisement spending globally, with an estimated $298 billion.
- Ad spending on social media will reach $219.8 billion.
- Non-programmatic ad spending will hold a 20% share, while programmatic will have 80%.
- The FMCG sector holds a 21.6% share of ad spending globally.
| Industry | Share Of Digital Ad Spending |
|---|---|
| FMCG | 21.60% |
| Retail | 12.30% |
| Pharma & Healthcare | 8% |
| Entertainment & Media | 7.60% |
| Telecommunications | 7.10% |
| Financial Services | 6.80% |
| Travel & Leisure | 6.80% |
| Business Services | 5.60% |
| Automobiles | 4.30% |
| Government | 4% |
| Other | 15.90% |
Source: Statista
E-commerce Marketing Statistics
The e-commerce scene has been booming for the last decade, and the COVID-19 pandemic gave a considerable push to that growth. The E-commerce sector is now worth $4.9 billion. These e-commerce statistics are crucial for your Digital Marketing Strategy.

You can check our dedicated post on E-commerce Statistics Here.
- 2.14 billion people, equivalent to 27% of the world’s population, are shopping online.
- 69% of total eCommerce traffic comes from an organic source (Google)
- 60% of Millennials will visit Amazon before making a purchase online.
- The average conversion rate for e-commerce websites is between 1.81% and 3.71%
- People trust product reviews from their friends and family 80% of the time.
- E-commerce websites have a conversion rate of 2.90%
- Shopify has the most out of 24 million e-commerce websites globally, with 5.6 million.
- 64.7% of online shoppers prefer to buy products that have content written in their mother tongue.
- The CRO strategy is not present in 68% of small-scale businesses.
Mobile Commerce Statistics
Mobile e-commerce accounts for $3.4 trillion in retail e-commerce sales. That is HUGE! While mobile phones are now the preferred way of doing almost anything online due to the ease of use and availability, optimizing your marketing campaigns for mobile phones is important.

Here is a list of statistics that will help you do so.
- Smartphones account for 70% of all eCommerce visits.
- 93% of millennials use smartphones to compare online deals.
- 53% of smartphone users prefer to shop from their favorite business’s app.
- 65% of customers surf similar products on their mobile phones while in a store.
- $3.4 trillion worth of online retail e-commerce sales come from smartphones.
- M-commerce websites’ bounce rates increase by 32% when their loading times jump from 1 to 3 seconds.
- 32% of customers decide whether to buy something in a store after looking up a similar product online on their smartphones.
- Mobile application conversion rates are 3x higher than a mobile website.
- Over 70% of online buyers prefer to buy from well-optimized websites that offer them a smoother shopping experience.
- 62% of customers are less likely to shop with you again if they have a bad experience with your website’s functionality.
- Adding Call To Action buttons can increase clicks by 45%.
- 61% of people tend to shop on mobile websites that allow them to apply search filters.
Sources: Demandsage Survey, Lucid Advertising,
SEO Statistics

- The SEO industry is worth over $50 billion.
- Organic traffic is responsible for 53% of traffic to all websites.
- Brands with a dedicated blog have 55% more traffic than those that don’t.
- 75% of people don’t go beyond Google’s first result page.
- Leads generated via SEO have a 15% closing rate.
- The #1 page on Google’s search results has an average 32% click rate.
- The #1 page has 1500 words on average.
- Nearly 50% of businesses claim that SEO is their best ROI generator.
- 86% of people ignore paid advertisements.
- More than half (55%) of the world’s internet traffic comes via smartphones.
- 92% of keywords have less than 10 searches each month.
- 25% of small business websites don’t have an H1 tag.
- Semrush is the most widely used SEO tool, with over 10 million paying users.
We reviewed Semrush with real-world examples. Check it out!
Local SEO Statistics
Local SEO is important for businesses of all sizes, but it is especially important for small businesses and local businesses that have walk-in customers.

Here are some insights pointing towards the importance of local SEO.
- 88% of people who search for a local business over the web are likely to visit it within 24 hours.
- 36% of local searches result in a purchase
- Local searches contribute 22.6% of website traffic.
- 82% of consumers read online reviews for local businesses
- 93% of consumers use Google Maps when searching for a business.
- 54% of smartphone users search for business hours on Google.
- Google My Business listings with contact information receive 94% of calls on working days.
- 71% of people surveyed say that positive Google My Business reviews made them more likely to use a business
Source: Ahrefs, Hubspot, Think With Google, Gitnux, Publer.io, Grazemarketing.
Content Marketing Statistics
Organic search and referral traffic are the largest and most effective sources of marketing ROI for brands. In every industry, from technology to manufacturing and non-profits to pharma,

And it’s all generated by content marketing. So here are some insightful facts about content marketing that will help you curate your digital marketing strategy.
Sage Reads: Insights on content marketing.
- Nearly 80% of very successful content marketers spend more than 10% of their total marketing budgets on content. Just 52% of those who are unsuccessful spend more than 10%.
- Short-form videos have the highest ROI of 31%. Meanwhile, blog posts and images have an ROI of 15% and 22%, respectively.
| Content Format | ROI |
|---|---|
| Short Form Video | 31% |
| Images | 22% |
| Blog posts | 15% |
| Case studies | 15% |
| Podcasts and other audio content | 14% |
- The majority of the marketers said that “researching the audience” was the #1 factor for achieving success in content marketing.
Here is the list of other top factors that marketers consider important:
| Factor | Share Of Votes Received |
|---|---|
| Researching the audience | 47% |
| Search Engine Optimization | 465% |
| Publishing More Content, Increasing Posting Frequency | 45% |
| Improving The Quality and Value of Our Content | 44% |
| Updating and Repurposing Existing Content | 42% |
| Analyzing Competiton | 41% |
- Even though the highest quality leads are generated via organic traffic and referrals, acquiring them isn’t a piece of cake. That is why marketers rate “attracting quality leads with content” as the most challenging thing while doing content marketing.
Here is a table showing the other top challenges:
| Content Marketing Challenges | Share Of Votes |
|---|---|
| Attracting Quality Leads With Content | 45% |
| Creating More Content Faster | 38% |
| Generating Content Ideas | 35% |
| Generating Enough Traffic Via Content | 35% |
| Generating ROI and Sales With Content | 34% |
| Ranking In Search Engines | 29% |
- 27% of marketers have a content marketing budget of less than $1000 monthly. Twenty percent have a budget of 3 to 5K, while only six percent have a budget of over $20,000.
- 52% of marketers say social media and community building are top priorities, followed by improving content quality and audience research.
- 45% of marketers say that Videos are the top-performing content for their brands.
Here is a table showing the top-performing content for marketers globally:
| Content Type | Share Of Votes |
|---|---|
| Videos | 45% |
| Short-form Articles | 31% |
| Success Stories | 28% |
| Long-form blog posts | 24% |
| Case Studies | 19% |
| Webinar and Online Events | 18% |
Digital PR Statistics 2025
- 96% of PR professionals expect their budgets to grow over the next three years, marking a 15% increase compared to the previous year.
- Nearly all surveyed professionals predict a tighter integration between PR and digital marketing in 2024.
- The most common applications of AI in PR are content iteration, media pitches, and content development.
- 80% (4 out of 5) PR professionals use the term “branded content” in their public relations strategies.
PPC Statistics
PPC (pay-per-click) can start driving qualified leads to your site quickly while you also invest in organic means.

Let us take a look at some interesting figures associated with PPC advertising in this section.
- Companies are projected to spend $190.5 billion on search advertising globally.
- Over 50% of ad clicks happen on mobile devices.
- PPC generates 2x the visitors as compared to SEO.
- PPC returns $2 for every $1 spent, which means the ROI of a PPC campaign is around 200%.
- 65% of SMBs have a PPC campaign.
- Mid-sized businesses invest between $9,000 to $10,000 on PPC every month.
- The Google Display Network is the leading PPC provider, with over 2 million sites in its program.
- 65% of all high-intent searches result in an ad click.
- Paid ads and social media accounts for less than 10% of B2B website traffic, leads, or sales.
Source: Statista, WebFX, Ahrefs, Google Ads.
Website Statistics
Websites are a great way to improve your authority in the digital market. We have covered some interesting figures on how a website should be and how it affects user experience online.
Have a look below:
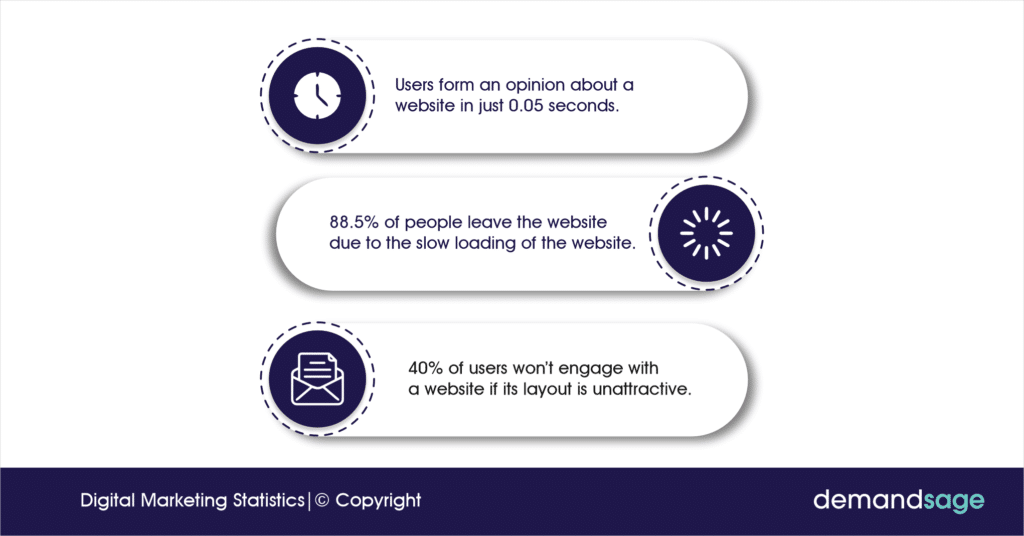
- Users form an opinion about a website in just 0.05 seconds.
- 88.5% of people leave the website due to the slow loading.
- Slow-loading websites cost retailers $2.6 billion in sales annually.
- Mobile website users expect a website to load in under three seconds.
- Videos on a website can increase the average time spent on a page by 88%.
- Website visitors spend an average of 6.44 seconds focused on the main navigation menu.
- WordPress is the most popular CMS, housing 42.4% of the internet’s websites.
- 40% of users won’t engage with a website if its layout is unattractive.
- 50% of internet users say that they consider website design as a factor in formulating their opinion on a business.
We have written a detailed post on website statistics, which you might be interested in. This will give you a clearer idea!
Sources: Forbes, Demandsage, Similarweb, Neil Patel, Semrush.
Social Media Marketing Statistics
Social Media Marketing, or SMM, is a popular branch of Digital Marketing. Social media usage is growing day by day, especially in short-form video consumption.
Currently, an average social media user spends 2 hours and 31 minutes on social media platforms. In this section, we will discuss Statistics from various social media. This will help you plan your next SMM strategy.

- The social media marketing sector is worth $160 billion and is projected to reach $223 billion.
- There are over 4.95 billion social media users globally.
- Businesses allocate around 15% of their marketing budget toward social media marketing.
- Over 90% of brands do social media marketing.
- Facebook advertising is the most popular ad program globally, with nearly 86% of businesses on Facebook using its advertising platform.
- Facebook and Instagram have an ROI of 29%. Meanwhile, by investing in YouTube, businesses get an ROI of 26%.
| Social Media Platform | ROI Of The platform |
|---|---|
| 29% | |
| 29% | |
| YouTube | 26% |
| TikTok | 24% |
| Twitter/X | 16% |
| 16% |
- TikTok is the fastest-growing social media.
Below is the list of the Top Social media:
| Social Media Platform | Monthly Active Users |
|---|---|
| 3.07 billion | |
| YouTube | 2.50 billion |
| 2.0 billion | |
| 2.0 billion | |
| TikTok | 1.60 billion |
| 1.36 billion | |
| Facebook Messenger | 977 million |
| Telegram | 900 million |
| Snapchat | 800 million |
| Douyin | 755 million |
| Kuaishou | 697 million |
| 588 million | |
| X/Twitter | 586 million |
Sources: DemandSage, WordStream, Meta, Bytedance, Wikipedia, TikTok, Influencer marketing hub, Bloomberg, The Verge, NY Times.
Meme Marketing Statistics
Memes are the most shared piece of content in current times. The majority of reels and TikToks are comic.
Videos and podcasts take time to record. Memes are the fastest to arrive after a major event. Many companies are capitalizing on this trend and are gaining reach.

Let us take a look at some interesting meme marketing insights in this section!
- At least 60% of social media users access the platform for content that’s funny.
- An average millennial looks up to 30 memes every day.
- 38% of the 55% of Gen-Zers and Millennials who share memes follow meme accounts.
- Memes are the second most shared content on social media after videos.
- The CTR of a meme campaign is 14% higher than that of email marketing.
- The global meme industry was valued at $2.3 billion in 2020 and is expected to reach $6.1 billion by 2025.
Influencer Marketing Statistics

Influencer marketing is yet another crucial part of Digital Marketing. This set of influencer marketing statistics will help you understand why your business needs to start investing in influencers ASAP!
- The influencer marketing sector is worth $14 billion.
- Influencer marketing has an ROI of 650%, as marketers get $6.5 for every $1 invested.
- 72% of Gen Z and Millennials follow influencers on social media.
- Nearly 56% of marketers from the United States and the United Kingdom use Instagram to collaborate with influencers.
- Micro-influencers are more popular than mega-influencers among marketers.
- 49% of consumers depend on influencer recommendations.
- By 2028, the Influencer marketing industry will be worth $85 billion.
Did you know? An Influencer marketing agency in India can help you craft the best marketing campaigns with influencers!
You can also explore our insights on influencer earnings to understand different types of influencers and how to find the right one for your brand.
Infographics In Digital Marketing
In the fast-paced online world, where 81% of readers skim content, visuals are crucial for digital marketing. Things like infographics are especially important because they catch people’s attention, help get messages across effectively, and make a lasting impression.
They are also a way to keep users on your page longer, decreasing the bounce rate. Infographics stats show that Infographics are 30 times more likely to be read than a written article.

Let us take a quick look at more such interesting stats on infographics in this section.
- Infographics can increase website traffic by up to 12%.
- Posts with images have a 650% higher engagement rate.
- The usage of infographics enhances the drive to read by 80%
- 45% of internet users will click on a link if they see an infographic in it.
- Infographics can be processed 60 times faster than plain text.
- Posts with infographics create 178% additional inbound backlinks.
- 70% of social media users would rather learn about a topic through infographics than text
Artificial Intelligence In Digital Marketing
AI has been around for a long time, but adoption rates drastically increased after the launch of ChatGPT. Not only for content creation, marketers use AI for various purposes such as image generation, Podcast script writing, and even video editing.
Marketers are also adapting to this shift and are investing in AI tools for marketing.

Take a look at these interesting stats about AI usage in marketing:
- In an insider intelligence survey, 76% of marketers said they use AI for basic content creation and to write copy.
- Gartner forecasts that 30% of outgoing marketing messages from big businesses will be generated by AI by 2025.
- According to Mailchimp, 50% of marketers believe inadequate adoption of AI is holding them back from achieving their goals.
- 19.2% of marketers spend more than 40% of their marketing budget on AI-driven campaigns.
- 91% of Fortune 1000 companies are increasing their investment in artificial intelligence.
- A Statista survey shows that the adoption of generative AI is highest in the marketing and advertising sector (37%). The other two sectors showing increased use of AI are technology (35%) and consulting (30%).
- 60% of marketers implement AI to predict customer behavior and needs.
- 26% of businesses are applying AI techniques such as NLP to marketing and sales
Bonus: Discover the latest trends and statistics shaping the future of personalization in our comprehensive post on Personalization Trends and Stats.
Future Of Digital Marketing
- It is predicted that 69% of the total advertising spend will be generated via smartphones. Be sure to optimize your social media campaigns for smartphones!
- One Statistic also reveals that 90% of mobile users are unaware of what they want to purchase, so they look for it online. Make sure you optimize your digital marketing campaigns for the ever-increasing mobile users.
- Over 50% of digital marketers will increase their content marketing budget, as per the Marketing Insider Group.
- Augmented Reality is the new big thing in the marketing sector. Market Research Future (MRFR) predicts that the worldwide augmented reality market is estimated to reach $461.25 billion by 2030. These predictions were based on the CAGR of the sector, which is 41.50%.
- 61% of shoppers prefer to shop from businesses that have augmented reality offerings.
- Voice search is another thing to look at; Google found out that over 50% of baby boomers use voice assistants to access information on the go.
How Much Do Digital Marketers Make
A digital marketing manager makes anywhere between $68k to $85k on average.
The pay scale depends on many factors, such as one’s expertise. An entry-level digital marketing manager may expect to earn an average of $42,800 per year. Mid-level managers can earn $72,500 per year, while senior-level digital marketing managers may make an average of $82,372 per year.
Do you know which are the best digital marketing agencies in the United States and India? Well, we have covered the top ones in the major cities of both countries. Here is a heads up — Read our take on the best digital marketing agency in Mumbai.
Did you know? Digital marketing jobs are considered to be the best option for digital nomads.
Conclusion: Digital Marketing Delivers 5x ROI on Every Dollar Spent
By 2032, digital marketing will reach $1.09 trillion, if it keeps growing at a 13.1% CAGR. Platforms like email marketing return $36 for every $1, while mobile ads drive 65% of total spending.
Moreover, 93% of millennials use smartphones to compare prices, and 88% of users form opinions about websites in just 0.05 seconds.
It is proven in my research that infographics boost engagement by 650%, and influencer marketing returns $6.5 per $1 spent.
With over 91% of Fortune 1000 companies investing in AI-driven campaigns, digital marketing in 2025 is smarter, faster, and more data-driven than ever before.
Sources: