


En bref
- Website Performance has shifted from a “nice-to-have” to a ranking and revenue lever, with Core Web Vitals acting as the shared scoreboard across teams.
- In 2026, the differentiator is Stability: keeping scores consistently “good” across releases, devices, and geographies—not just hitting targets once in a lab test.
- Web Tools increasingly blend field data (real users) and lab diagnostics (synthetic tests) to explain why Loading Time, Interactivity, or Visual Stability degrade.
- INP has become the day-to-day focus for product teams because it maps to real friction: menus that lag, “Add to cart” that feels stuck, forms that stutter.
- The best programs treat performance like reliability engineering: budgets, alerts, regression gates, and a repeatable playbook for fixes.
- Architecture choices (edge caching, selective hydration, headless stacks) can improve Page Speed, but only if governance prevents third-party and design drift.
Performance work used to be an argument between “the SEO person” and “the developer.” In 2026, it looks more like an operations discipline: measure, diagnose, ship, verify, and keep watch. The reason is simple—Google’s page experience signals have matured into something organizations can’t ignore. Core Web Vitals function as a public, comparable proxy for User Experience, and competitive markets treat them like table stakes. What’s changed is not the existence of the metrics, but how teams manage them: leading brands now prioritize Stability, aiming to keep LCP, INP, and CLS within “good” thresholds through continuous releases, A/B tests, personalization, and third-party tag changes.
This shift has reshaped the tool landscape. The most useful Web Tools no longer stop at reporting a score; they connect field data to root causes, highlight regressions by release, and show whether improvements persist at the 75th percentile—the level Google uses for evaluation. Consider a fictional but realistic company, Harbor & Pine Outfitters, whose ecommerce growth stalled despite strong content. Their audits revealed a pattern: every merchandising campaign introduced new scripts, nudging Loading Time upward and making Interactivity erratic on mid-range phones. The fix wasn’t a one-off “speed sprint.” It was a governance model: performance budgets, tag approvals, and ongoing monitoring. That’s the heart of the 2026 story—tools are converging around keeping Core Web Vitals consistently healthy, not occasionally impressive.
Modern Website Performance platforms increasingly behave like observability suites. Instead of producing a single report, they maintain a living map of experience quality across templates, geographies, and device classes. The center of gravity is Core Web Vitals, because they translate technical behavior into user-visible outcomes: how fast the main content appears, how quickly the interface reacts, and whether the screen jumps around. The 2026 emphasis on Stability reflects a hard lesson: a site can “pass” in a lab run and still fail in real traffic due to network variance, third-party scripts, or a new design component.
For Harbor & Pine Outfitters, the turning point came when the team compared synthetic tests with field data. Lighthouse looked respectable on a desktop profile, but their real-user mobile distribution showed INP spikes during peak hours. The tool insight that mattered was not “your score is low,” but “your checkout button interaction is delayed by long tasks triggered by the marketing carousel.” That diagnostic clarity is why the best tools blend sources: field telemetry (what customers actually felt) with lab traces (what caused it).
How stability thinking changes the way teams use Web Tools
Stability-oriented workflows start by grouping URLs by template and business purpose: product pages, category listings, editorial, checkout, and landing pages for paid campaigns. This prevents the classic trap of optimizing only the homepage. Then teams define guardrails: acceptable ranges for JavaScript weight, image payload, third-party tags, and font usage. When a deployment breaks the budget, the tool flags the regression before it spreads.
It’s also become common to tag performance events to releases. If a new personalization experiment increases Loading Time by 400ms at the 75th percentile, stability programs treat that like a bug, not a trade-off silently absorbed. This is where SEO strategy intersects with engineering discipline. Anyone tracking algorithm volatility has noticed how technical quality can tip close races in the SERPs, especially when competitors publish comparable content. For context on how fast these SEO environments move, many teams cross-check broader industry signals such as January SEO updates coverage while they correlate ranking changes with performance telemetry.
Case-style example: preventing “performance debt” during growth
Harbor & Pine introduced a new review widget to increase trust. Conversions improved—until mobile abandonment rose. The widget added third-party scripts that competed with main-thread work, degrading Interactivity. Rather than removing it, they reconfigured loading: delay non-essential review features until after the first meaningful interaction, and reserve layout space to protect Visual Stability. The result was a measurable lift in add-to-cart completion, and their vitals stopped swinging wildly between releases. The insight is straightforward: stability is a product decision as much as a technical one.
The next step is understanding the metrics themselves—especially how LCP, INP, and CLS now get operationalized inside teams.
Core Web Vitals in 2026: operational thresholds, field data, and why stability beats perfect scores
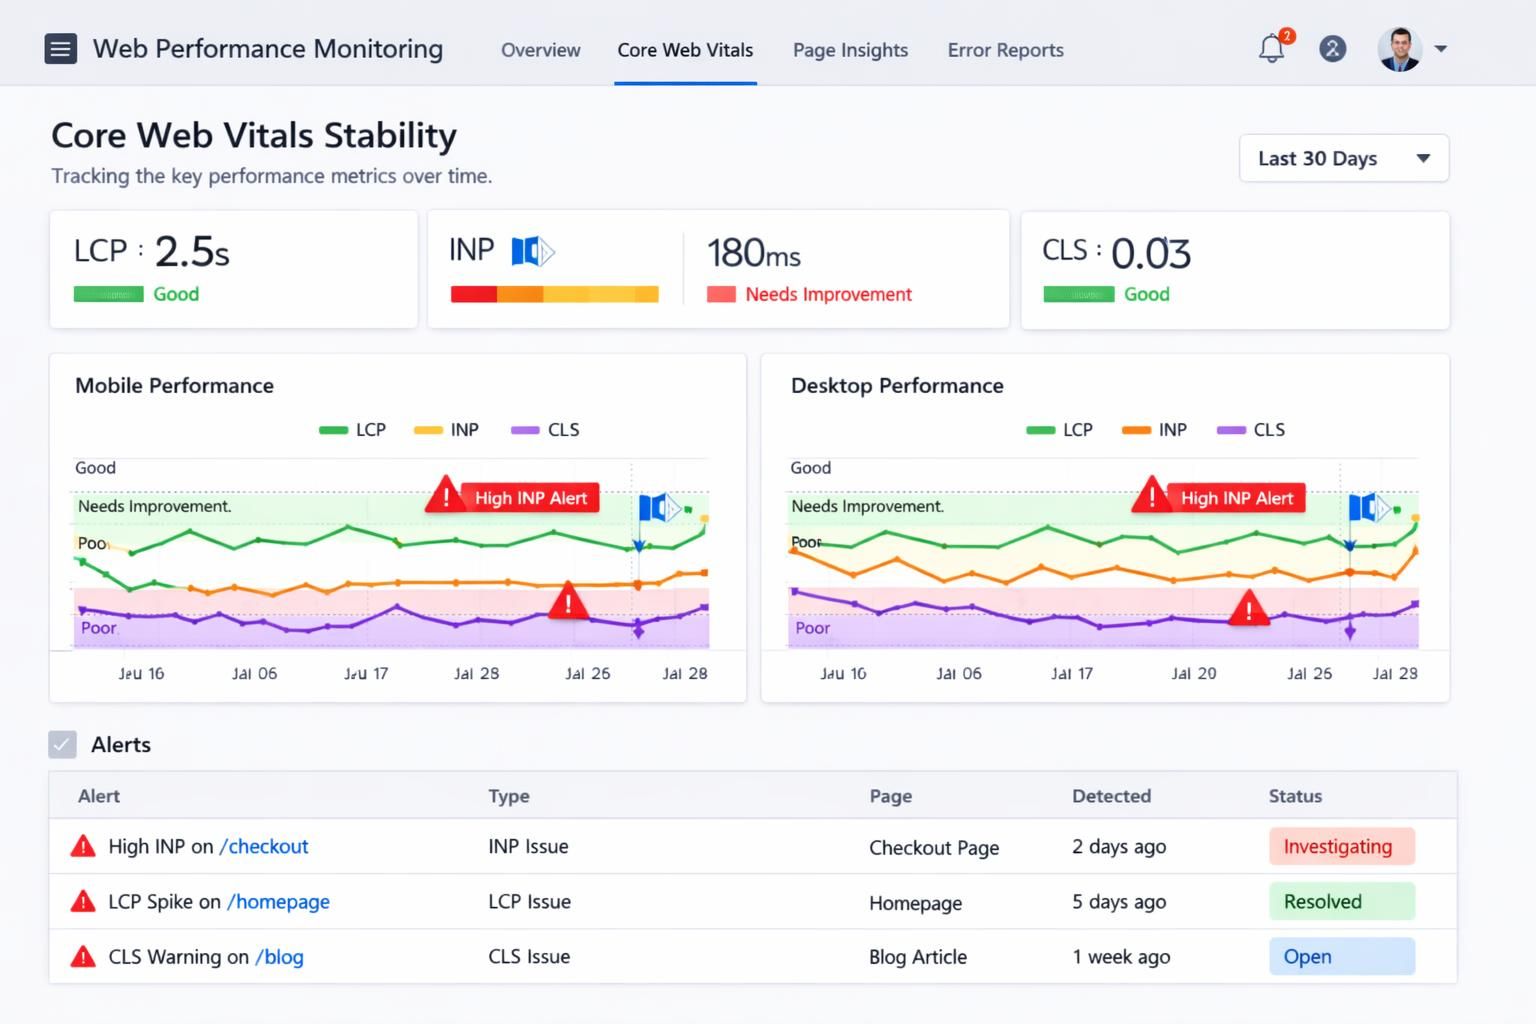
By 2026, most organizations can recite the definitions, but fewer run a consistent program around them. Core Web Vitals are still anchored by three pillars. LCP captures perceived Page Speed by timing when the largest above-the-fold element becomes visible; the commonly accepted target remains about 2.5 seconds or better for “good.” INP—which replaced FID in 2024—tracks responsiveness and aims for around 200ms or less, aligning directly with Interactivity. CLS quantifies Visual Stability, with “good” generally below 0.1 to avoid layout jumps that cause misclicks and frustration.
What makes 2026 different is how these numbers are judged inside companies. Teams have realized that chasing a lab-perfect score can lead to strange trade-offs—like stripping features that users actually value—while still not improving field performance for slower devices. The better approach is to win at the 75th percentile across real traffic. That means testing on mid-tier Android phones, simulating spotty connections, and paying attention to geographic latency and caching strategy. If a site only performs well on a developer laptop, it isn’t stable—it’s fragile.
Field vs lab: why two “truths” must be reconciled
Field data comes from real browsing sessions, often via CrUX-like sources, and reflects the messy reality of diverse devices, network conditions, and user behavior. Lab data, generated by tools like Lighthouse, provides controlled reproduction and detailed traces. Stability programs treat them as complementary: field data tells you where pain exists and how widespread it is; lab diagnostics help you fix it efficiently.
Harbor & Pine used this two-layer approach to resolve an argument between marketing and engineering. Marketing insisted their new hero image “loaded quickly” because they could see it on office Wi‑Fi. Field data told a different story: the hero was the LCP element, and it lagged on mobile in certain regions. The fix was not aesthetic compromise; it was delivery mechanics—responsive images, modern formats, and preloading the correct resource so the browser doesn’t guess wrong. The outcome improved User Experience without sacrificing brand visuals.
Stability as a KPI: building a “vitals SLO” mindset
Many teams now borrow from reliability engineering. Instead of celebrating a single best score, they define an SLO-like target: “95% of product pages must remain in ‘good’ for LCP and CLS, and 90% must remain ‘good’ for INP.” When a template slips, the team treats it like an incident. This is how Website Performance becomes measurable and maintainable.
That mindset also makes technical SEO more predictable. A periodic deep dive, like the kind described in technical SEO audit updates, becomes more actionable when paired with continuous vitals monitoring. Audits find structural issues; stability programs prevent regressions from reintroducing them.
Once the metrics are treated as ongoing service levels, optimization becomes a set of targeted plays—starting with the biggest visible moment: LCP.
Optimizing LCP for Page Speed and consistent Loading Time across devices
LCP is the metric most executives understand intuitively because it maps to first impressions: “Did the page feel fast?” Yet LCP is also the metric most often sabotaged by content decisions—oversized imagery, heavy fonts, and scripts competing for bandwidth. In practice, improving LCP in 2026 is less about a single trick and more about controlling the request pipeline from server response to render completion. Teams that achieve stable LCP treat above-the-fold content as critical infrastructure.
Server response, caching, and edge delivery
A slow origin makes every optimization downstream less effective. Harbor & Pine upgraded from overloaded shared hosting to a setup with aggressive server-side caching and a CDN. Their goal wasn’t “faster in theory,” but “predictable in practice,” especially during promotional spikes. When server response time stabilized, LCP variance dropped significantly because the browser could start fetching critical resources earlier.
Edge delivery also dovetails with modern architectural choices. Headless implementations can be fast when they minimize client-side rendering at first paint, but they can also become JavaScript-heavy if teams aren’t careful. The broader commerce ecosystem has been debating these trade-offs; discussions like headless commerce trends are useful context when deciding whether your stack improves real Page Speed or merely shifts complexity.
Making the LCP element “cheap”: images, fonts, and critical CSS
On many pages, the LCP element is a hero image or a large headline block. Practical improvements include serving responsive images with appropriately sized variants, compressing aggressively, and using modern formats like WebP or AVIF. If the hero is an image, it should load early—lazy loading it often backfires. For typography-heavy pages, font loading can become the bottleneck; preloading key fonts and using sensible fallbacks reduces the time until content is visually complete.
Critical CSS is another frequent win. If the browser must download a large stylesheet before it can paint the main content, LCP drifts upward. Inline the minimum needed for above-the-fold layout, defer the rest, and be disciplined about unused CSS. The goal is not minimalism for its own sake; it’s ensuring that the first screen is fast and consistent.
A targeted checklist teams can actually enforce
To keep LCP improvements from evaporating, Harbor & Pine used a release checklist that product and marketing had to respect. It wasn’t punitive; it prevented accidental regressions that would otherwise go unnoticed until rankings and revenue dipped.
- Ensure the LCP element is prioritized: preload the hero image or critical font when appropriate.
- Constrain payload size: set a performance budget for above-the-fold images and critical CSS.
- Reduce render blockers: defer non-critical scripts and styles so the main content can paint.
- Use a CDN and caching: stabilize response time during traffic spikes.
- Validate with field data: confirm that Loading Time improves at the 75th percentile, not just in the lab.
With LCP under control, teams often discover that the next bottleneck isn’t what users see—it’s how the interface feels when they touch it. That’s where INP dominates the 2026 conversation.
Seeing responsiveness issues explained visually can help align stakeholders, especially when the gap between “it works” and “it feels instant” is subtle.
INP-focused Web Tools: fixing Interactivity with main-thread discipline
INP has become the metric that exposes “death by a thousand cuts.” A page might look loaded, but a tap on a filter, a click on a navigation drawer, or a form input can lag because JavaScript is monopolizing the main thread. In 2026, teams that win on Interactivity treat JavaScript like a budgeted resource, not an unlimited convenience. The most effective Web Tools now surface INP culprits as narratives: “This interaction was slow because a long task ran here, triggered by this script, while the browser tried to paint.” That story is what helps cross-functional teams act.
Breaking long tasks without breaking the product
Harbor & Pine had a classic problem: a “quick add” component that updated price, inventory, and recommendations on every variant change. It felt slick on desktop, but mid-range phones struggled. The fix was to split work into smaller chunks, defer non-essential updates until idle time, and move heavier computations off the main thread where possible. The user-visible result was immediate feedback—buttons responded instantly—even if background updates completed moments later.
This is an important psychological point: users don’t require everything to finish instantly; they require the interface to acknowledge them quickly. Improving INP often means designing for perceived responsiveness—optimistic UI updates, skeleton states, and predictable transitions—while reducing main-thread contention.
Third-party scripts: the silent INP killers
Chat widgets, A/B testing frameworks, affiliate tags, and elaborate analytics setups can all erode responsiveness. Stability programs implement a quarterly third-party audit and require justification for each tag. If a script adds measurable latency, it must earn its keep. This is where performance becomes governance: someone must own the decision to ship a tag that could degrade User Experience.
Table: mapping fixes to Core Web Vitals outcomes
|
Optimization move |
Main metric improved |
Typical difficulty |
Why it helps stability |
|---|---|---|---|
|
Code-splitting and deferring non-critical JS |
INP, LCP |
Medium |
Reduces main-thread contention and lowers the chance that new features cause interaction regressions. |
|
Breaking long tasks and yielding to the browser |
INP |
High |
Prevents single scripts from blocking paints during taps, clicks, and typing. |
|
Reducing third-party tags |
INP, LCP |
Medium |
Limits unpredictable script behavior that can change without your release process. |
|
Minimizing DOM size and complexity |
INP |
Medium |
Speeds up rendering and event handling, keeping interaction latency consistent on weaker devices. |
|
Edge caching for HTML and critical assets |
LCP |
Medium |
Stabilizes first paint timing across regions, reducing variance during traffic surges. |
|
Reserving space for media and embeds |
CLS |
Low |
Prevents layout jumps that appear when content arrives late or asynchronously. |
When INP is addressed, many sites feel dramatically “new” even if the design hasn’t changed. But that feeling can be undermined if the page shifts under the user’s finger—making CLS the final pillar of stable experience.
Visual Stability and CLS: designing pages that don’t fight the user
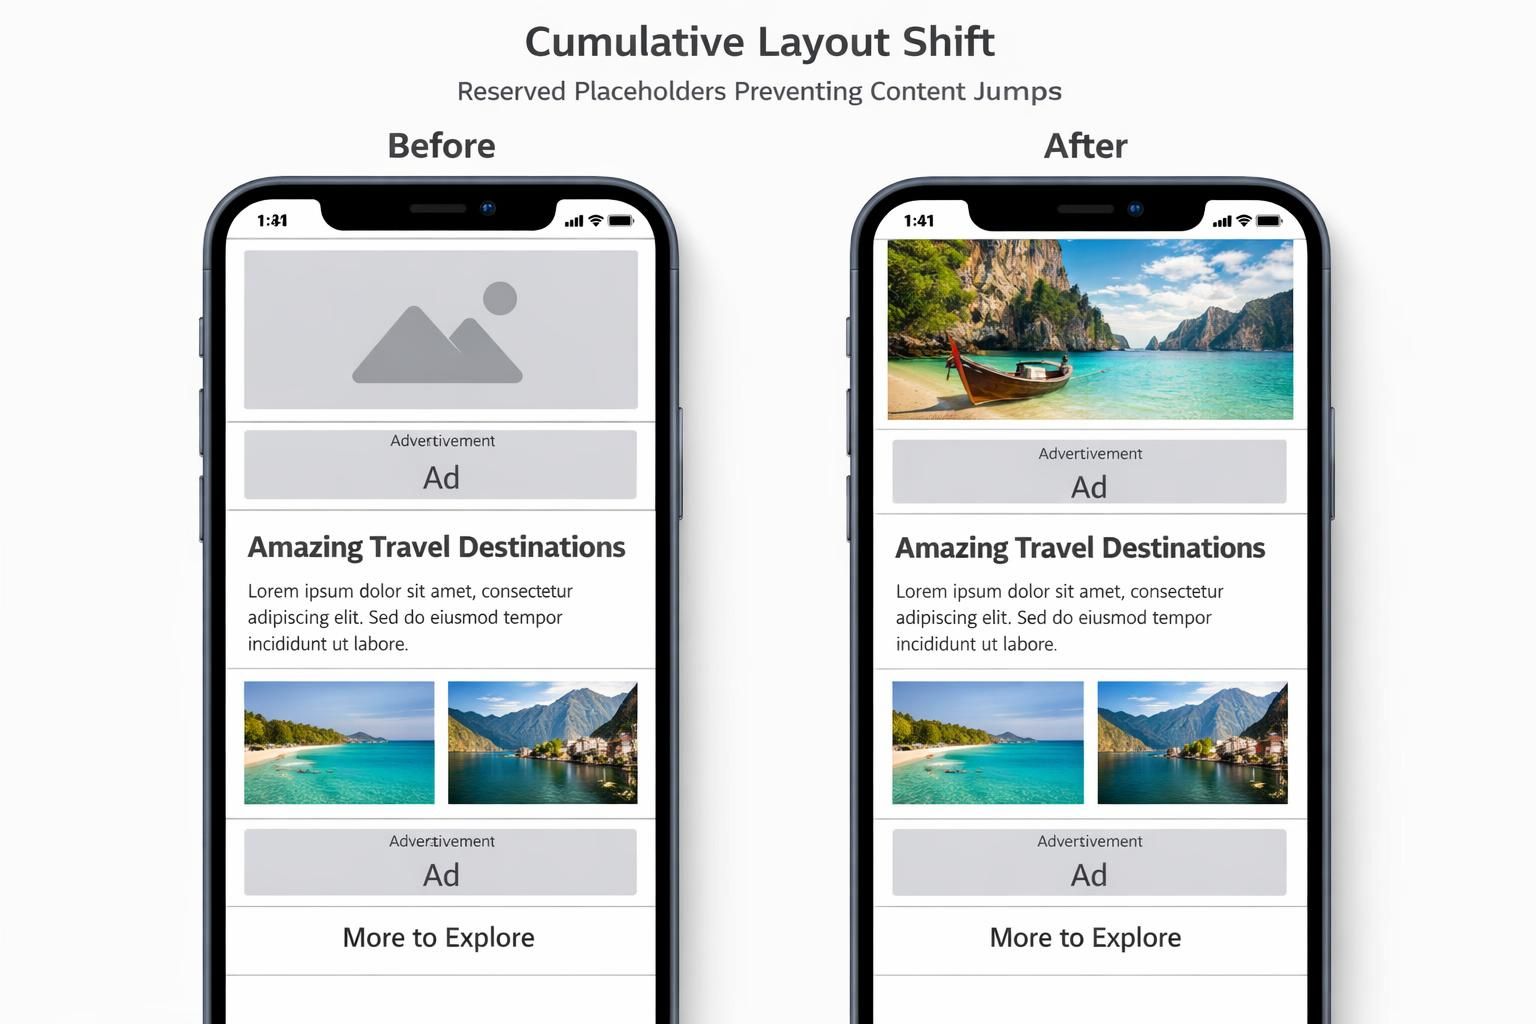
Visual Stability is the most human of the three pillars: it’s the difference between a page that feels calm and one that feels chaotic. CLS captures those moments when a user tries to tap “Buy,” and the button jumps because an image, ad slot, or font arrives late. In 2026, visual stability is increasingly discussed alongside brand trust. A shifting layout reads as sloppy, even if the product is good. That perception affects engagement, repeat visits, and conversions—especially on mobile where screen real estate is tight.
The predictable causes of layout shift (and why they keep returning)
CLS problems often reappear because they’re introduced by content workflows rather than engineering intent. A marketer uploads an image without fixed dimensions. An ad provider changes creative sizes. A developer adds a “You might also like” block above the fold that renders after API data returns. Each change is reasonable on its own; collectively, they destabilize the page.
Harbor & Pine had an embarrassing episode: during a seasonal sale, their promotional banner loaded late and pushed product titles downward, leading to accidental clicks and angry support emails. The fix was straightforward—reserve space for the banner and ensure that only user-triggered insertions can move content above the fold. The broader lesson was cultural: performance and design systems must agree on rules, not just aesthetics.
Fonts, embeds, and the “layout contract”
Fonts are a subtle CLS driver. If a custom font loads late and the fallback font has different metrics, lines reflow and the page shifts. Teams mitigate this by preloading critical fonts, using sensible fallback stacks, and setting font-display to reduce invisible text. Embeds—maps, social posts, video players—also need explicit containers so the browser knows how much space to reserve before content loads.
Stability programs describe these as a “layout contract”: every component must declare its dimensions upfront or allocate space through CSS. When that contract is enforced in the design system, CLS improvements scale across the site rather than being patched page by page.
Keeping CLS stable through continuous change
The hardest part of CLS isn’t the initial fix; it’s preventing regressions. Harbor & Pine added automated checks in their CI pipeline to flag templates where images lacked width/height attributes or where dynamic modules appeared above the fold. They also reviewed ad placements and ensured that any responsive ad slot had a reserved range of heights so late-loading creatives didn’t shove content around.
Understanding CLS is also a communication tool. When stakeholders see that layout jumps lead to misclicks and lost trust, visual stability becomes a shared priority rather than a developer complaint. The next logical step is to tie all three metrics into a monitoring rhythm so the site remains fast, responsive, and steady as Trends and features evolve.
Teams often benefit from a practical walkthrough of diagnosing CLS and layout shifts across real templates and devices.
Monitoring Core Web Vitals stability: continuous Website Performance governance for 2026 trends
Once a site is optimized, the real work begins: keeping it that way. Continuous delivery, personalization, new analytics tags, seasonal campaigns, and CMS-driven content can all degrade vitals quietly. The best 2026 programs treat Core Web Vitals as a living system with feedback loops. They monitor changes, attribute regressions, and build habits that protect User Experience as the product grows.
What to monitor weekly vs quarterly
Weekly monitoring focuses on “what changed”: are certain templates slipping from good to needs-improvement, and did that coincide with a release? Teams watch LCP and INP by device class because mobile drift is usually the early warning sign. Quarterly reviews focus on “what accumulated”: third-party scripts, plugin bloat (especially on WordPress), and design system creep. This cadence keeps Website Performance tied to real operations, not annual cleanups.
Performance budgets as a product constraint, not a developer preference
Budgets work when they’re framed in outcomes. Harbor & Pine didn’t say “no more JavaScript.” They said: “new features must not push INP beyond the target on mid-tier phones.” That makes performance a shared constraint like accessibility or uptime. When teams internalize that constraint, they naturally look for lighter implementations, better caching, and fewer dependencies—without needing constant policing.
Connecting vitals to business metrics (so the work keeps getting funded)
Executives fund what they can measure. Harbor & Pine tied improvements to reduced bounce rates on category pages and higher checkout completion on mobile. They also noticed that landing pages with better Page Speed performed more efficiently in paid campaigns, supporting better ROI. The precise uplift varies by industry, but the pattern is consistent: stable speed and responsiveness reduce friction, and reduced friction boosts revenue.
In crowded search results, these gains become strategic. When content parity exists, experience quality becomes the differentiator. That’s why 2026 Trends point toward tighter integration of SEO, engineering, and product analytics: the winners are the teams that can ship quickly without destabilizing the experience. The enduring insight is that stability is not a one-time milestone—it’s the competitive advantage you maintain.