

* For commercial use only
Based on your interests
Free Statistics
Premium Statistics
- Free + Premium Statistics
- Reports
- Market Insights
Other statistics that may interest you E-commerce in the United States
Overview
7
Leading players
7
Online traffic & mobile apps
8
Device usage
5
Online shoppers
6
Segments
6
* For commercial use only
Based on your interests
Free Statistics
Premium Statistics
- Free + Premium Statistics
- Reports
- Market Insights
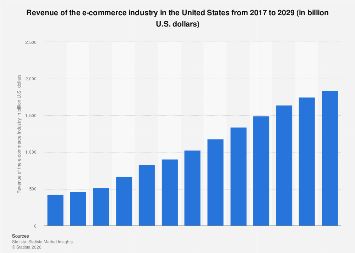
Statista. (July 1, 2025). Revenue of the e-commerce industry in the United States from 2017 to 2029 (in billion U.S. dollars) [Graph]. In Statista. Retrieved February 06, 2026, from https://www.statista.com/statistics/272391/us-retail-e-commerce-sales-forecast/
Statista. “Revenue of the e-commerce industry in the United States from 2017 to 2029 (in billion U.S. dollars).” Chart. July 1, 2025. Statista. Accessed February 06, 2026. https://www.statista.com/statistics/272391/us-retail-e-commerce-sales-forecast/
Statista. (2025). Revenue of the e-commerce industry in the United States from 2017 to 2029 (in billion U.S. dollars). Statista. Statista Inc.. Accessed: February 06, 2026. https://www.statista.com/statistics/272391/us-retail-e-commerce-sales-forecast/
Statista. “Revenue of The E-commerce Industry in The United States from 2017 to 2029 (in Billion U.S. Dollars).” Statista, Statista Inc., 1 Jul 2025, https://www.statista.com/statistics/272391/us-retail-e-commerce-sales-forecast/
Statista, Revenue of the e-commerce industry in the United States from 2017 to 2029 (in billion U.S. dollars) Statista, https://www.statista.com/statistics/272391/us-retail-e-commerce-sales-forecast/ (last visited February 06, 2026)
Revenue of the e-commerce industry in the United States from 2017 to 2029 (in billion U.S. dollars) [Graph], Statista, July 1, 2025. [Online]. Available: https://www.statista.com/statistics/272391/us-retail-e-commerce-sales-forecast/