

CFA-reliability and validity
The standardized factor loadings (SFLs) in the measurement model with a good model fit (refer to the results in Table 4) were used to assess the composite reliability (CR) and average variance extracted (AVE). Tables 2 and 3 show the results of the reliability and validity analyses, respectively. Table 2 shows the factor loadings and CR values of constructs. For example, the construct of dynamic characteristics (DC) had a CR value of 0.95; atmosphere clues (AC), 0.97; perceived interactivity (PIA), 0.95; immersive experience (IE), 0.95; social interaction (SI), 0.93 and purchase intention (PI), 0.85. All values of CR and SFLs exceeded the minimum requirement of 0.70, indicating good construct reliability (Hair et al. 2010).
Table 3 demonstrates adequate convergent and discriminant validities because all values of AVE exceeded 0.50, and the square roots of AVE (the diagonal elements) were greater than the inter-construct correlations (the off-diagonal elements in the corresponding rows and columns); therefore, the measures reported good reliability and validity (Hair et al. 2010). Table 3 also displays the key variables’ means, standard deviations, and Pearson correlations. All variables were closely correlated (r ranged from 0.60 to 0.75, p < 0.01). In addition, the study performed a supplementary analysis to ascertain whether the data adhered to the assumption of collinearity using a stringent threshold of a variance inflation factor (VIF) value exceeding 4.0 or a Tolerance value less than 0.2 (Hair et al. 2010). The testing results indicated that multicollinearity was not a concern among highly correlated exogenous variables because all values of VIF and Tolerance ranged between 2.55–3.50 and 0.27–0.39, respectively (DC: Tolerance = 0.39, VIF = 2.55; AC: Tolerance = 0.27, VIF = 3.50; PIA: Tolerance = 0.36, VIF = 2.77; IE: Tolerance = 0.37, VIF = 2.72; SI: Tolerance = 0.33, VIF = 3.01).
Model fit
We performed confirmatory factor analysis (CFA) and structural equation modeling (SEM) to evaluate the measurement and structural models, respectively. Table 4 shows the results of the assessment of model fit, which was assessed by goodness-of-fit indices (GFIs), including chi-square to the degree of freedom (χ2/d.f.) ratio, goodness-of-fit index (GFI), comparative fit index (CFI), incremental fit index (IFI), standardized root mean square residual (SRMR), and root mean square error of approximation (RMSEA). It must be mentioned that the ratio of χ2/d.f. was an alternative evaluation of the χ2, especially when our observations were more extensive than 200 (Kline 2011). A model fit is favorable or acceptable when the ratio of χ2/d.f. is equivalent to 1.0–3.0 or 3.0–5.0, the GFI is above 0.90 or 0.80, the CFI and IFI are both above 0.95 or 0.90, and the SRMR and RMSEA are both below 0.05 or 0.08 (Hair et al. 2010). The results of GFIs suggest that the measurement and structural models are both above acceptable.
Path analysis
We used simultaneous equations modeling to test the hypothesized model (see results in Table 5). Following a similar practice recommended by Cohen (1988), we analyzed mediation when mediators were introduced in the relationship between independent and dependent variables. The results showed that dynamic characteristics were related to the immersive experience (β = 0.15, p < 0.001), which in turn led to the purchase intention (β = 0.39, p < 0.001). Because of the significant relationship between dynamic characteristics and purchase intention (β = 0.08, p < 0.05), the immersive experience partially mediated the relationship. Thus, H1 is partly supported. However, Social interaction did not mediate the relationship because the effect of dynamic characteristics on the social interaction was not significant (β = 0.02, ns.), even though there were significant relationships between social interaction and purchase intention (β = 0.22, p < 0.001). Thus, H4 is not supported.
Furthermore, immersive experience partially mediated the relationship between atmosphere clues and purchase intention because relationships of atmosphere clues–immersive experience, immersive experience–purchase intention, and atmosphere clues– purchase intention were all found significant (β = 0.58, p < 0.001; β = 0.39, p < 0.001; β = 0.21, p < 0.001, respectively). Similarly, the results also indicated that atmosphere clues were related to social interaction (β = 0.48, p < 0.001), which in turn led to the purchase intention (β = 0.22, p < 0.001). Social interaction partially mediated the relationship, given the significant relationship between atmosphere clues and purchase intention (β = 0.21, p < 0.001). Thus, H2 and H5 are partially supported.
Lastly, perceived interactivity was found to be related to the immersive experience (β = 0.25, p < 0.001), which in turn led to the purchase intention (β = 0.39, p < 0.001). Given the nonsignificant relationship between perceived interactivity and purchase intention (β = 0.04, ns), the immersive experience completely mediated the relationship. Similarly, social interaction entirely mediated the relationship between perceived interactivity and purchase intention because both relationships of perceived interactivity–social interaction (β = 0.50, p < 0.001) and social interaction–purchase intention (β = 0.22, p < 0.001) were also found significant. Thus, H3 and H6 are fully supported.
Model power
Cohen (1988) suggests that the R2 values of 0.01, 0.09, and 0.25 can be used as threshold values to demonstrate predictive power. As for the explained variance, the proposed model presented well squared multiple correlations (R2) for the dependent variables (above 0.25): immersive experience (R2 = 0.42), social interaction (R2 = 0.48), and purchase intention (R2 = 0.47). These results suggest that large impacts on the endogenous variables were captured in the hypothesized model (see Fig. 2).
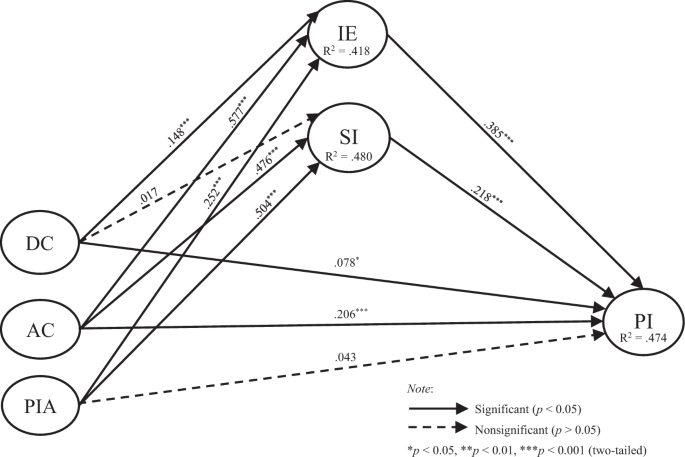
This figure shows the results of the S-O-R transitions. DC dynamic characteristics, AC atmosphere clues, PIA perceived interactivity, IE immersive experience, SI social interaction, PI purchase intention.