
Overview of data analysis methods
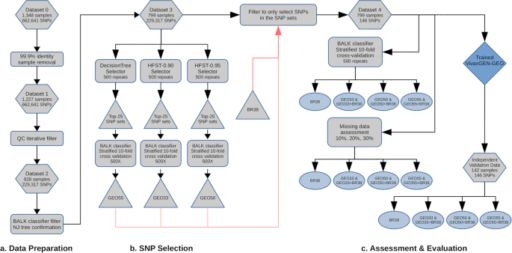
The project aimed to generate two major outputs: a new framework to identify P. vivax geographic barcodes (i.e., marker selection) and an online, open-access informatics platform for end-users to analyze data generated using the barcode. A flow diagram outlining the steps involved in identifying P. vivax geographic barcodes is provided in Fig. 1. The process involved three key steps: 1) data preparation to produce a dataset with the optimal balance of number of samples and SNPs and with no missing data (i.e. no genotype fails), 2) SNP selection using Decision Tree and HFST approaches to obtain candidate SNP panels suitable for the classifier developed in this study (a Bi-Allele Likelihood, BALK classifier) and, and 3) comparative evaluation of the candidate SNP panels, assessment of the impact of missing data (i.e., genotype fails), and assessment of the prediction accuracy with an independent dataset. An online, open-access informatics platform was then developed and equipped with BALK classifiers trained against the candidate SNP panels. A more comprehensive description of the methods is provided in the Supplementary Methods.
Data set
The study used genomic data on P. vivax derived from the Malaria Genomic Epidemiology (MalariaGEN) P. vivax Genome Variation Project release 4 (Pv4), which has recently been published as an open dataset26. The Pv4 open data set comprises genomes from 26 countries. At the time of conducting our analysis (i.e., prior to the Pv4 open access release), a dataset comprising 1873 (of the 1895 samples described in the release) samples was available for our study. For the analysis in this study, the dataset was divided into two parts, a training dataset, and a validation dataset. The validation set consisted of isolates from 7 countries (Brazil, Cambodia, Colombia, Ethiopia, Peru, Thailand, and Vietnam) derived from a clinical trial conducted by GlaxoSmithKline (GSK)26. All remaining isolates were included in the training dataset, which comprised representation of all the countries in the validation set. The GSK samples were selected for independent validation owing to convenience as the samples from this study were sequenced later than the other studies and, hence, the data was made available later.
Data preparation
An overview of the data preparation steps is outlined in section a) of the flowchart presented in Fig. 1. Briefly, the training dataset was filtered to exclude recurrent infections and samples from countries represented by less than 4 independent P. vivax genomes, resulting in an initial dataset comprising 1,348 samples from 21 countries (Supplementary Table 1, Supplementary Fig. 4). With this initial dataset, from the initial 2,671,112 variants discovered in the MalariaGEN Pv4 project26, we derived a set of 662,641 high-quality bi-allelic SNPs with VQSLOD score > 0, minimum depth of 1 and minimum Minor Allele Count (MAC) of 2 to produce Dataset 0. The restriction to bi-allelic SNPs is a standard approach undertaken in malaria population genomics to simplify downstream computations and does not impose constraints on the analysis of polyclonal infections, which are still detectable through the composite of allelic variants across the respective SNPs (see27,28,29). Individual genotype calls were defined as heterozygotes based on an arbitrary threshold of a minor allele ratio > 0.1 and a minimum of 2 reads for each allele; all other genotype calls were defined as homozygous for the major allele. Dataset 0 was further filtered to exclude non-independent samples, defined arbitrarily as isolate pairs with genetic distance less than 0.001, resulting in 1,227 samples with 662,641 SNPs, denoted as Dataset 1. Dataset 1 was then subjected to iterative data quality filtering to derive the best representative number of samples and informative SNPs without any genotype missingness by iteratively removing samples with higher missingness and calculating the number of informative SNPs (defined as SNPs with MAC > = 2), from the remaining samples. Based on the plot of the result of this data quality filtering (Supplementary Fig. 1), we identified 826 samples and 229,317 SNPs to be included in Dataset 2. The isolates in Dataset 2 were initially assigned to country based on the available metadata, which was further evaluated using 1) country-level prediction using the BALK classifier against all 229,317 SNPs and 2) manual confirmation by constructing a neighbor-joining tree based on genetic distance. Isolates whose country assignment differed from the prediction result and that were not in the same country cluster as observed manually from the neighbor-joining tree were considered suspected imported infections and removed from the dataset to produce Dataset 3, comprising 799 samples and 229,317 SNPs. For comparative assessment of candidate SNP panels, a new dataset (Dataset 4) was produced which comprised the samples in Dataset 3, but only the SNPs selected by the consecutive SNP selection process (we refer to these SNP panels as GEO barcodes) and 38 assayable SNPs from a commonly used 42-SNP P. vivax barcode developed by the Broad institute12. The SNP panel comprising the 38 assayable Broad Institute barcode SNPs is referred to as BR38. The BR38 SNP panel was integrated in the study for evaluation on its own as well as in combination with the newly selected GEO SNP panels as it has been implemented in several countries.
A similar filtering process was applied to the validation set. All recurrent infections were removed, and the SNP positions were filtered to only include the 229,317 SNPs defined in the training Dataset 4. Any remaining non-independent samples were then removed using the same 0.001 threshold of genetic distance, using a similar procedure to that described for the training set. Country-level assignment was assessed using the same trained BALK classifier as the training set, and a neighbor-joining tree was constructed by combining with Dataset 3 for manual confirmation. After the various filters, a set of 142 samples remained in the validation set. Supplementary Fig. 2 presents the neighbor-joining tree of Dataset 3 combined with the 142 validation samples at the 229,317 SNPs. Further SNP filtering to only include the BR38 panel and newly selected GEO SNPs were performed to produce the Independent Validation Dataset. More detailed information on the data preparation methods is available in the Supplementary Methods.
Bi-Allele likelihood classifier
Our study required the development of flexible methods to classify P. vivax infections/genetic data by country. For this purpose, we required a classifier with the following properties: 1) capable of evaluating existing SNP panels, 2) amenable to new SNP additions to accommodate new countries or genetic shifts over time, 3) able to classify data inputs containing genotype fails and bi-allelic heterozygous genotype calls arising from polyclonal infections, and 4) able to provide confidence values of prediction. We identified the Naive Bayes classifier as having the properties that cater to the above requirements after application of several modifications. We derived a Bi-Allele Likelihood (BALK) classifier from Bernoulli Naive Bayes with modification by replacing the likelihood equation of its classification rule from the Bernoulli probability distribution to a binomial N = 2 distribution to handle the heterozygous calls and setting the prior probability to a uniform distribution, making the classifier only depend on the likelihood of the SNP data. The BALK classification rule is presented in equation 1.
$$\max Pr(C|X)\sim Pr(X|C)=\mathop{\prod }\limits_{i}^{n}{p}_{i}^{{x}_{i}}\cdot {(1-{p}_{i})}^{(2-{x}_{i})}$$
(1)
Where X is the SNP data set of a sample, C is a group (or a country), xi is the number of alternate alleles at position i and pi is the frequency of the alternate allele at position i of country C counted as diploid samples. A more comprehensive description of the development of BALK classifier is available as Supplementary Methods.
Candidate SNP selection
Our objective was to identify the most parsimonious SNP panels for country-level classification, aiming for less than 60 SNPs in these panels; this threshold for the new SNP panels was based on several considerations. In accordance with the multiplexing features of the Illumina platform and considering primer, library preparation and sequencing costs, as well as the practical challenges of preparing PCR pools across large numbers of primers, we identified a maximum of 100 SNPs in total (across the new SNP panels and previously described Broad barcode i.e., BR38) as a feasible threshold for a geographic barcode for P. vivax.
An overview of the candidate SNP selection steps is outlined in section b) of the flowchart presented in Fig. 1. Optimal SNPs for country classification were selected using the following approaches: DecisionTree, HFST-0.90 and HFST-0.95 (HFST with Fst threshold of 0.9 and 0.95 respectively), which are detailed in the Supplementary Methods. Briefly, for the DecisionTree (DT) approach, Dataset 3 was subjected to a DT implementation of the Python sklearn library. The SNP set selected by DT was then reassessed with the BALK classifier in the training set using country-level MCC (Matthew Correlation Coefficient) scores as well as pooled (cross-country) median and minimum MCC scores. The MCC provides a measure of the quality of the classifications, ranging from -1 (total disagreement) to 1 (perfect prediction)30. For the HFST (Hierarchical FST) approach, as a bifurcating tree guide, a neighbor-joining population tree was constructed based on Nei’s net average population genetic distance matrix and then re-rooted at the midpoint (Supplementary Fig. 5). The HFST approach entailed traversing across the bifurcating guide tree and randomly selecting the SNPs with FST higher than a certain threshold between the two populations represented by the two nodes of the branch. If none of the SNPs were above the threshold during guide tree traversal, the DT method was employed to obtain additional SNPs to separate the two nodes of the branch. As with the DT approach, country-level MCC scores and pooled (cross-country) median and minimum MCC scores of each of selected SNP set were calculated using the BALK classifier trained against the selected SNPs with Dataset 3.
For each approach, Dataset 3 was used for both training and testing set in 500 repeats to obtain 500 SNP sets. The top-25 SNP sets from the 500 SNP sets, ranked based on the average of their minimum MCC and median MCC scores over country-level MCC scores, were collected and subjected to the 500 repeats of stratified 10-fold cross-validation to avoid over-fitting each SNP set by re-ranking based on their average minimum MCC and median MCC scores to derive the best SNP set for each approach.
Comparative assessment of candidate SNP panels
An overview of the steps involved in the comparative evaluation of the SNP panels is outlined in section c) of the flowchart presented in Fig. 1. To compare the Broad SNP panel to the three new candidate SNP panels identified by DT, HFST-0.90, and HFST-0.95 approach a 500 repeat, stratified 10-fold cross-validation was undertaken on each SNP panel using Dataset 3.
Additionally, to assess the durability of prediction performance of the candidate SNP panels with different levels of missing data (analogous to genotyping failures), simulations were run after removing genotype data randomly. The BALK classifier was trained against the candidate SNP panels using all samples. For each country, 25 samples were sampled randomly with replacement and genotype calls were removed from the SNP sets in 10%, 20% and 30% proportions. The random samples were then subjected to the trained classifier. This process was run in 250 repeats and the MCC score of the prediction for each country was reported.
To evaluate the performance of the candidate SNP panels with new sample sets (as opposed to using the re-sampling technique of the cross-validation strategy), the trained BALK classifiers were run on the Independent Validation Dataset and MCC scores reported for each country.
Web-based data analysis and sharing platform for end-users
To establish accessible informatics tools for end users, an online platform was created incorporating data classification tools for determining the most likely country of origin of a sample using genetic data derived from different barcodes. Existing source code, developed for a microsatellite-based P. vivax data sharing and analysis platform31, was modified to create a new web-based platform (vivaxGEN-geo), to collate SNP data generated at the geographic barcode. This approach was chosen owing to the ability to i) incorporate manual SNP sets allowing incremental improvements of the barcode in future, ii) evaluate barcodes with incomplete data owing to genotyping failures, and iii) evaluate heterozygous genotype calls, which reflect polyclonal infections. For optimal accuracy, the BALK classifier provided on the online platform has been trained with 941 samples, comprising Dataset 2 (N = 799) plus the Independent Validation Dataset (N = 142). The classifier tool reports the three highest likelihoods for country of origin and their associated probabilities. The classifier tool reports the three highest likelihoods for country of origin and their associated probabilities. The probabilities were computed using the isotonic method as implemented in CalibratedClassfierCV of sklearn library, with stratified 4-fold cross-validation for the calibration dataset. The web platform can receive the input data in string-based barcode representation, column-based tab-delimited text files, and VCF files.
Ethics
All samples were collected with written informed consent from patients, or their legal guardians as detailed in the Malaria Genomic Epidemiology (MalariaGEN) P. vivax Genome Variation Project release 4 data note26.
Reporting summary
Further information on research design is available in the Nature Portfolio Reporting Summary linked to this article.