


Key Findings From the Study
- U.S. marketing employment grew by 12% between 2022 and 2024
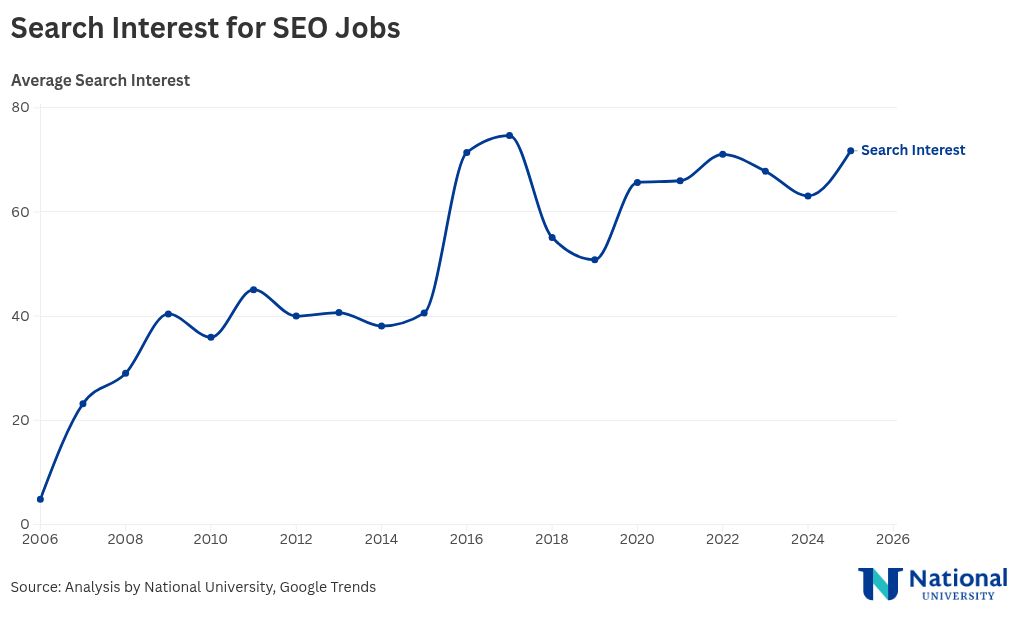
- SEO job interest remains strong, hitting 71.8 in early 2025
- Mid-level SEO roles make up 59% of all SEO jobs today
- AI-related skill requirements in SEO job postings are up 21%
- Top states for marketing opportunity include New York, California, and Massachusetts.
Despite the explosion of digital marketing roles, many professionals are still struggling to match their skills with the right markets.
A new study from National University reveals that the rise of SEO and AI has fundamentally changed marketing employment, but most professionals aren’t yet optimizing their careers for this reality.
The analysis draws from recent Google Trends data and U.S. Bureau of Labor Statistics records, examining where marketing jobs are growing, how SEO is driving hiring trends, and which states offer the best return on skill investment.
These changes signal a widening gap between traditional marketing paths and the digital-first jobs employers actually want.
“Today’s marketing world rewards searchability, agility, and data literacy, not just creativity,” says Tim Prestianni, Director of SEO & Digital Content at National University.
Where Is SEO Career Interest Heading?
Search interest in SEO jobs has remained surprisingly strong for nearly a decade, highlighting its status as a foundational marketing skill.
- SEO job search interest peaked at 74.7 in 2017 and rebounded to 71.8 in early 2025
- Average interest has stayed above 60 for the past eight years, even as other digital trends come and go
- Between 2018 and 2024, interest held steady between 50–70, signaling long-term employer and jobseeker alignment
- Recent years: 2023 (67.8), 2024 (63.1)
“Search visibility is now a core part of brand strategy,” says Prestianni. “Professionals who understand how SEO works have a major advantage in both job performance and job security.”
Where Are the Fastest-Growing Marketing Roles?
Even with strong overall job growth, not all roles are expanding equally, and the biggest gains are in strategic and technical roles.
- Mid-level SEO jobs now make up 59% of all listings, reflecting demand for skilled, experienced professionals.
- SEO is now a core requirement in many in-house marketing roles, not a separate specialization.
- AI-related skills are up 21% in job descriptions, along with growing mentions of UX and data analytics.
- Employers are prioritizing marketers who understand the intersection of search, automation, and performance.
This shift reflects a growing divide between traditional creative roles and data-savvy digital professionals.

How Is Marketing Employment Changing?
National marketing job growth has been consistent, but the biggest gains are happening in areas tied to technology and strategy.
- Marketing-related employment rose from 3.77 million to 4.22 million between 2022 and 2024, a 12% increase.
- Top employment categories include:
- Advertising, Marketing, PR & Sales Managers: 1.12M
- Marketing & Sales Managers: 988K
- Market Research Analysts & Marketing Specialists: 861K
- Marketing Managers: 385K
- Wage growth was strongest among Market Research Analysts, rising 9.63%.
- Managerial roles still lead in compensation:
- Marketing Managers: $171,520
- Marketing & Sales Managers: $165,050
- Market Research Analysts: $86,480
“Growth is strongest in roles that focus on interpreting data and guiding strategy,” says Prestianni. “Creative ability still matters, but it has to be paired with the ability to measure results.”
Where Are the Strongest State-Level Opportunities?
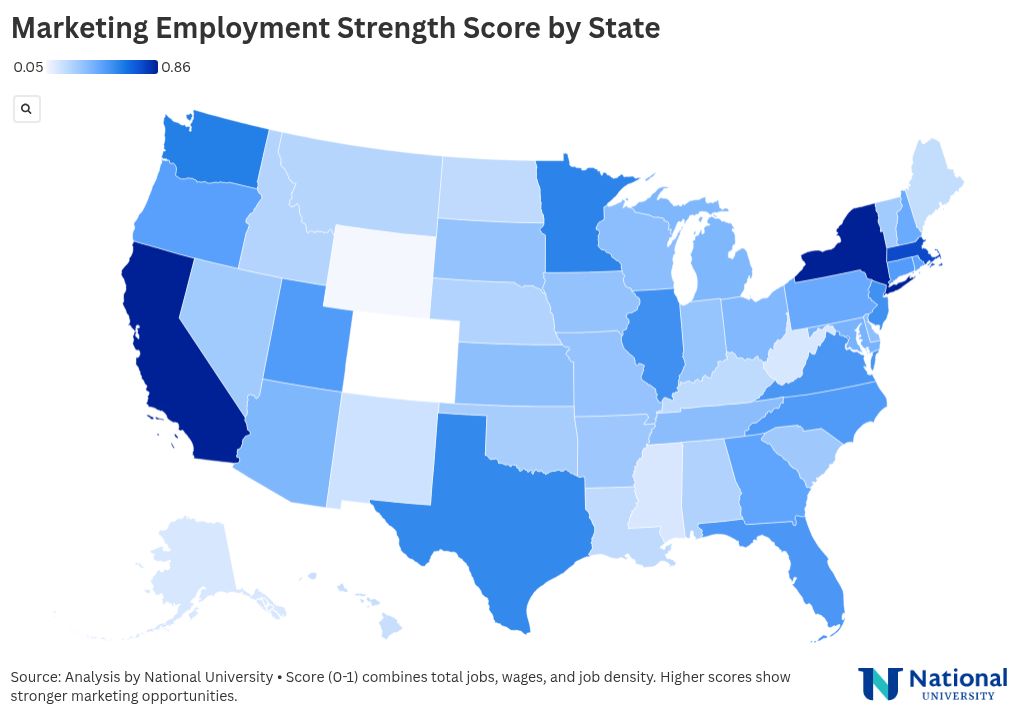
Job opportunities vary widely depending on the state, not just in volume, but in salary and accessibility.
- New York and California are tied for the top composite score (0.863), combining job volume, salary, and job density.
- Massachusetts has the highest job concentration (6.98 jobs per 1,000 workers) and strong wages ($150,155).
- The District of Columbia and Washington also stand out with high job density and six-figure average salaries.
- States like Louisiana and West Virginia offer high wages relative to job concentration, creating strong value for professionals willing to relocate.
- The South holds the largest share of marketing jobs overall (about 33%).
“In some markets, there are fewer jobs but less competition, and wages are surprisingly strong,” says Prestianni. “Professionals should look beyond the largest cities and consider where their skills go further.”
Score by State
State
Total Employment
Mean Salary
Jobs per 1,000
Score
New York
124580
147685
6.53
0.86
California
164760
156465
4.56
0.86
Massachusetts
50840
150155
6.98
0.75
District of Columbia
9300
141665
6.56
0.61
Washington
35800
145190
5.06
0.59
View More
| State | Total Employment | Mean Salary | Jobs per 1,000 | Score |
|---|---|---|---|---|
| Minnesota | 33260 | 130900 | 5.7 | 0.57 |
| Texas | 105120 | 114380 | 3.8 | 0.56 |
| Illinois | 57020 | 119600 | 4.7 | 0.53 |
| New Jersey | 34720 | 142355 | 4.08 | 0.52 |
| Virginia | 32040 | 139955 | 3.94 | 0.5 |
| Florida | 74720 | 115380 | 3.8 | 0.5 |
| North Carolina | 41160 | 124250 | 4.2 | 0.48 |
| Utah | 19870 | 109665 | 5.81 | 0.48 |
| Connecticut | 16450 | 125990 | 4.89 | 0.48 |
| Oregon | 17990 | 126075 | 4.57 | 0.46 |
| Rhode Island | 4660 | 127395 | 4.71 | 0.45 |
| Georgia | 35180 | 125955 | 3.62 | 0.44 |
| Pennsylvania | 43940 | 115090 | 3.65 | 0.43 |
| New Hampshire | 6370 | 118520 | 4.66 | 0.42 |
| Maryland | 18960 | 120905 | 3.45 | 0.38 |
| Arizona | 22370 | 113525 | 3.5 | 0.37 |
| Michigan | 29400 | 111500 | 3.35 | 0.37 |
| Ohio | 34370 | 110125 | 3.11 | 0.36 |
| Tennessee | 21670 | 108315 | 3.31 | 0.34 |
| Wisconsin | 19460 | 108490 | 3.33 | 0.34 |
| Delaware | 4050 | 101290 | 4.25 | 0.33 |
| Kansas | 9650 | 111420 | 3.37 | 0.33 |
| South Dakota | 1460 | 115085 | 3.22 | 0.32 |
| Iowa | 10500 | 106795 | 3.36 | 0.31 |
| Missouri | 19040 | 101800 | 3.26 | 0.31 |
| Indiana | 18520 | 107345 | 2.91 | 0.31 |
| Arkansas | 7950 | 105380 | 3.08 | 0.29 |
| South Carolina | 12480 | 107675 | 2.75 | 0.29 |
| Vermont | 1640 | 113270 | 2.7 | 0.28 |
| Nevada | 9450 | 101500 | 3.09 | 0.28 |
| Oklahoma | 9060 | 104300 | 2.68 | 0.26 |
| Alabama | 10440 | 98750 | 2.5 | 0.24 |
| Nebraska | 5820 | 94315 | 2.86 | 0.23 |
| Idaho | 4480 | 96330 | 2.65 | 0.23 |
| Montana | 2000 | 109165 | 1.96 | 0.23 |
| Kentucky | 7440 | 100325 | 1.86 | 0.2 |
| Louisiana | 6380 | 103235 | 1.67 | 0.2 |
| North Dakota | 1740 | 99505 | 2.06 | 0.2 |
| Maine | 4120 | 74730 | 3.25 | 0.19 |
| Hawaii | 2040 | 99635 | 1.64 | 0.18 |
| New Mexico | 2490 | 97480 | 1.45 | 0.16 |
| West Virginia | 2030 | 89970 | 1.44 | 0.13 |
| Alaska | 690 | 96400 | 1.08 | 0.13 |
| Mississippi | 3650 | 85615 | 1.57 | 0.13 |
| Wyoming | 940 | 61490 | 1.68 | 0.05 |
Which Metro Areas Offer the Most (and Best Paid) Marketing Jobs?
Some cities offer a rare mix of high wages, dense job availability, and employer demand. Each are critical for career growth.
- New York–Newark–Jersey City leads the country with 124,940 marketing jobs.
- San Jose, CA tops the salary chart at $215,905, followed by:
- San Francisco ($178,665)
- Seattle ($154,670)
- Boston ($152,605)
- New York ($151,260)
- San Jose and Boston also lead in job density, with 8.74 and 7.75 jobs per 1,000 workers, respectively.
- Other top metros include Chicago, Los Angeles, Minneapolis, and Washington, D.C., which balance job availability with competitive pay.
Top 20 Metropolitan Areas for Marketing Jobs
Metropolitan Area
Total Employment
Average Salary (USD)
Jobs per 1,000
Score
New York-Newark-Jersey City, NY-NJ
124940
151260
6.67
0.7949
San Jose-Sunnyvale- Santa Clara, CA
19830
215905
8.74
0.7195
San Francisco-Oakland- Fremont, CA
36380
178665
7.56
0.6461
Boston-Cambridge- Newton, MA-NH
41980
152605
7.75
0.6223
Seattle-Tacoma- Bellevue, WA
26920
154670
6.46
0.5305
View More
| Metropolitan Area | Total Employment | Average Salary (USD) | Jobs per 1,000 | Score |
|---|---|---|---|---|
| Minneapolis-St. Paul-Bloomington, MN-WI | 25630 | 135920 | 6.64 | 0.5006 |
| Los Angeles-Long Beach-Anaheim, CA | 56320 | 137215 | 4.54 | 0.4951 |
| Chicago-Naperville- Elgin, IL-IN | 45720 | 122640 | 5.11 | 0.4649 |
| Bridgeport-Stamford- Danbury, CT | 5550 | 136010 | 6.89 | 0.4583 |
| Washington-Arlington-Alexandria, DC-VA-MD-WV | 29620 | 143880 | 4.75 | 0.4447 |
| Provo-Orem-Lehi, UT | 4530 | 110400 | 7.58 | 0.4388 |
| Raleigh-Cary, NC | 9140 | 128530 | 6.32 | 0.4296 |
| Portland-Vancouver- Hillsboro, OR-WA | 14140 | 132775 | 5.82 | 0.4294 |
| Salt Lake City-Murray, UT | 11140 | 113550 | 6.82 | 0.4294 |
| Dallas-Fort Worth-Arlington, TX | 38270 | 117410 | 4.78 | 0.4213 |
| Durham-Chapel Hill, NC | 4090 | 138335 | 5.97 | 0.4189 |
| Fayetteville-Springdale-Rogers, AR | 3400 | 126505 | 6.37 | 0.4129 |
| Austin-Round Rock-San Marcos, TX | 14100 | 126740 | 5.59 | 0.4086 |
| Atlanta-Sandy Springs-Roswell, GA | 25100 | 130145 | 4.37 | 0.3916 |
| Miami-Fort Lauderdale-West Palm Beach, FL | 14930 | 115915 | 5.37 | 0.3816 |
Bottom 20 Metropolitan Areas for Marketing Jobs
Metropolitan Area
Total Employment
Average Salary (USD)
Jobs per 1,000
Score
Vineland, NJ
100
72020
1.67
0.1043
Grand Island, NE
80
63020
2.05
0.1041
Huntington-Ashland, WV-KY-OH
350
81920
1.23
0.1037
Gadsden, AL
80
53680
2.42
0.1032
Hammond, LA
100
60390
2.1
0.1016
View More
| Metropolitan Area | Total Employment | Average Salary (USD) | Jobs per 1,000 | Score |
|---|---|---|---|---|
| San Juan-Bayamon- Caguas, PR | 1980 | 72625 | 1.44 | 0.1003 |
| Kokomo, IN | 70 | 60100 | 2.08 | 0.1002 |
| Great Falls, MT | 70 | 60990 | 2.01 | 0.0987 |
| Las Cruces, NM | 150 | 82045 | 0.98 | 0.0927 |
| Aguadilla, PR | 110 | 76225 | 1.13 | 0.0887 |
| Owensboro, KY | 80 | 64470 | 1.62 | 0.0885 |
| Hinesville, GA | 40 | 58080 | 1.89 | 0.0885 |
| Alexandria, LA | 120 | 56550 | 1.95 | 0.0885 |
| Lake Charles, LA | 190 | 58230 | 1.86 | 0.0876 |
| Beckley, WV | 90 | 52160 | 2.11 | 0.0874 |
| Houma-Bayou Cane-Thibodaux, LA | 150 | 60380 | 1.76 | 0.0872 |
| Fairbanks-College, AK | 50 | 61600 | 1.51 | 0.0785 |
| Farmington, NM | 50 | 69620 | 1.17 | 0.0783 |
| Parkersburg-Vienna, WV | 60 | 53160 | 1.73 | 0.0728 |
| Hattiesburg, MS | 220 | 48160 | 1.8 | 0.0669 |
Why Some Professionals Are Still Missing Out
While opportunities are increasing, many marketers feel left behind. It is not because there’s no demand, but because they haven’t adjusted to it.
- SEO is still seen by some as optional, despite being embedded in most modern job descriptions.
- High-paying states often have lower job density, creating intense competition for fewer roles.
- Many professionals overlook high-value states and cities with fewer applicants but strong salaries.
- Entry-level talent is over-supplied, while mid-level roles now dominate hiring pipelines.
“Understanding where your skills are valued most is just as important as having the skills themselves,” says Prestianni. “This kind of insight helps professionals navigate smarter, not just louder.”
What’s Next
Marketers looking to stay competitive should:
- Prioritize SEO and AI fluency as they’re no longer optional.
- Target markets that balance job availability and wages, not just prestige.
- Use data to plan career moves, not just job titles or remote flexibility.
- Focus on middle-tier roles that dominate the hiring landscape.
“The smartest marketers will treat their careers the same way they treat campaigns: test, optimize, and scale where the returns are best,” says Prestianni.
Methodology
This analysis is based on Bureau of Labor Statistics (BLS) data from 2022-2024, examining both national and state-level marketing employment trends. For state-level analysis, we developed a composite scoring system that equally weights three key metrics: total employment, average annual wages, and job concentration (jobs per 1,000 workers). This approach allows for a balanced evaluation of each state’s marketing job market, considering both absolute opportunity size and relative market conditions. Additionally, we integrated Google Trends data for SEO jobs to understand the evolution of digital marketing interest over time, highlighting how changes in search interest correlate with growing demand for SEO expertise in the marketing industry.