Sustainability Strategy Prioritization and Financial Value Driver Tool for Portfolio Companies
This updated, two-part assessment and strategy tool assists GPs and Investors in analyzing both target and acquired portfolio companies’ current performance on sustainability-related material issues and provides guidance on which sustainability strategies and practices can drive financial value for the target company.
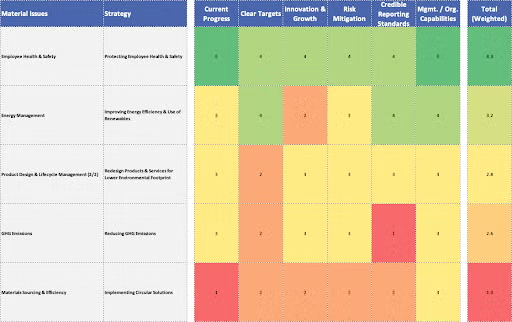
The tool is intended to be used first during the due diligence phase to gain a high-level assessment of where the company stands regarding its sustainability-related material issues. In Stage 1, after selecting the Industry, the model automatically populates the relevant material issues (aligned with SASB industry standards) as well as NYU CSB-defined strategies, practices, and value drivers. The tool then guides the assessment of the target company across several criteria for each material issue, using easy drop-down menu choices. This assessment establishes a pulse check on the target company’s performance, identifying red flags and upside opportunities. Results are captured in a heat map (Figure 1).
Figure 1: Due Diligence Heat Map

In Stage 2 (generally during the early holding period of the acquired company), the tool scores or ranks sustainability-related risks and opportunities that can drive improved financial performance, prioritizing material issues– which then informs strategy and KPI development. Based on issue prioritization, the tool provides example practice(s), KPIs, and monetization methods based on NYU CSB’s ROSI methodology that can be used to quantify and track sustainability initiatives.
Conducting this type of analysis at the beginning of the investment allows the GP to identify and prioritize key material issues early on and craft strategies and KPIs to address the areas which add value to the portfolio company. Tracking sustainability and financial KPIs over time allows the GP to create a record of sustainability improvement (while mitigating key risks) over the lifetime of the holding. At exit, the GP can more easily articulate the sustainable growth story and greater resilience within the portfolio company.
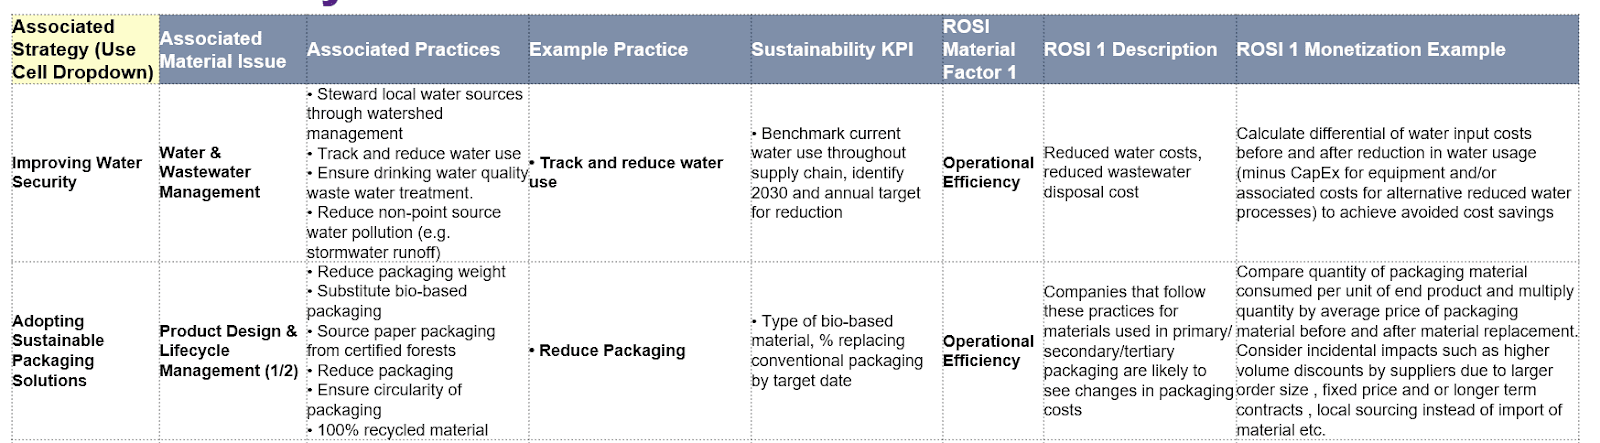
Output from Stage 2 includes an issue prioritization (materiality) matrix (Figure 2) and database of value drivers, example practices, KPIs, and monetization methods for each material issue that the user has decided to prioritize (Figure 3).
Figure 2: Scatterplot highlighting sustainability strategy priorities
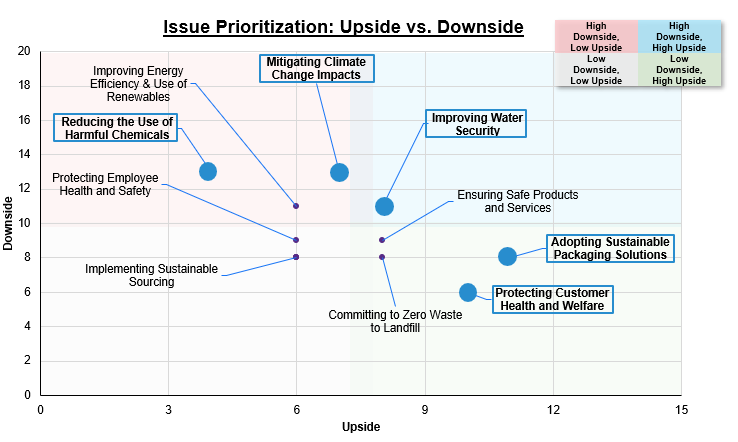
Figure 3: Database of sustainability and related value creation (ROSI) KPIs
After identifying ROSI KPIs in this tool, we encourage users to refer to the ROSI website to get additional monetization tools and ideas to take your analysis to the next level of detail regarding value creation through sustainability initiatives.
We welcome your feedback. Please reach out for any questions, comments, or guidance: sustainablebusiness@stern.nyu.edu
Following are the links to the open-source, Excel-based GP tools. We suggest you review the deck for a quick introduction. You may wish to review the tool with the Kraft Heinz example input to see how it works in action.
After identifying ROSI KPIs in this tool, explore the ROSI page on NYU Stern CSB’s website for additional monetization tools & ideas. Access the site here.